1500 words, 6 minutes.
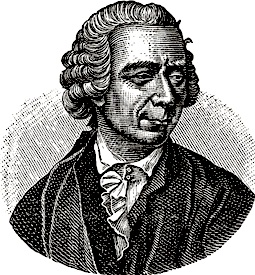
“For the sake of brevity, we will always represent this number by the letter e” - Leonhard Euler, Mechanica. 1736. Illustration Pub. 1881.
What if you could understand and explain any breach 10x faster?
Security breaches are a staple of mainstream news. In the past, details only emerged through technical analysis, research papers, and the forensic review of press releases. Occasionally we’d be gifted with a customer letter or the suspicious timing of a patch or update. A rumour, a leak, a resignation. Sometimes the first clue would be the appearance of huge data sets on the dark web. We’d have to put the pieces together ourselves. Today, news organisations and publishers have dedicated Cyber Security correspondents and legislation makes large breaches a notifiable event. Some victims even manage to be pro-active in their disclosure and details of the clean-up. Somehow breaches became a drama.
“A dull, dry technical breach, enabled by simple negligence becomes a story about an embattled CEO’s fight for survival. A partial leak of personal financial data becomes a story about corporate power and regulation. A hack of dating profiles becomes a tale of gender discrimination. Apologising won’t shift you out of the blast zone.” - Breach Handling & The High Ground, The Eutopian, Oct 2017.
There’s a downside to breaches becoming a mainstream drama. Most publications are advertising supported and articles are spread over multiple pages. They’re often longer than necessary and less information dense. All of this is an expected consequence of the subject matter moving into the mainstream. I find some of those practices tiresome but forgivable. However, I’ve noticed some more serious problems with recent coverage:
- The headline is plain wrong, sometimes the opposite of reality.
- The lede imbricates more than the facts can support.
- The narrative is more creative-writing than certitude.
Advertised participants turn out not to be participants at all, name-dropped for clicks. Stories are embellished with elements of the milieu of the sector, geography, and politics of the time. Finally, there’s the ridiculous imagery used throughout this industry. I’ve written about that before. I recently had to read through a 10 minute, multi-page article twice just to understand:
- Who has been breached?
- What mechanism was employed?
- What data was involved?
- What happened to that data?
- Who the perpetrator was?
Hold The Baloney
The facts were scattered and surrounded by baloney and plot-lines. Could I imagine something better? There’s no standard way of describing a breach in terms that are simple, clear, and easy to communicate to others. How would I provide this information in such a way that would allow experts to instantly understand it while a wider audience enjoys the creative writing in the rest of the article?
Sometimes it helps to imagine how someone else would approach a problem, someone whose methods are proven but in a different discipline. To whom should one look for inspiration? They’d have to be good at explaining from first principals. Someone who can simplify without dumbing-down to the extent that the explanation becomes wrong. An educator, a communicator. Someone interesting and energetic. Someone able to turn esoteric into exoteric.
“I like cross-discipline learning that improves my ability to try-out different lenses on problems and therefore gain a greater understanding and find better solutions” - Arrival, The Eutopian, May 2017.
Richard P Feynman1 was a theoretical physicist. In the 40s and 50s, he devised simple, intuitive diagrams2 to show interactions between particles. Even a relative novice can understand a Feynman diagram at its most basic level. Yet the same diagram can also convey interactions in a way that Nobel Prize-winning physicists find useful. They take relatively complex equations and make them simple. Can Feynman help us explain breaches?
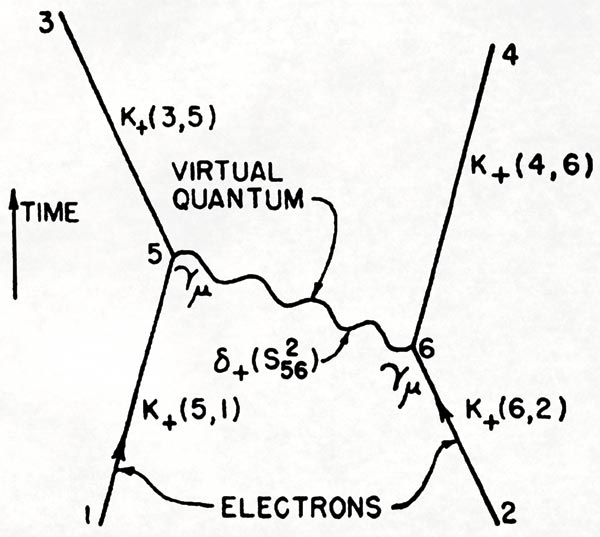 p.772 of Feynman, R. P.: 1949 The Space-Time Approach to Quantum Electrodynamics, Physical Review 76, 769-89.
The Particle Physics Of A Breach
A breach is defined by at least one interaction between at least two entities. That interaction occurs via some method. It results in a change of state in those entities. That state change often relates to data one of them holds. The interaction may consist of one or more steps. It may lead to further interactions and changes of state in other entities unrelated to the original breach. In this way the effects of the original breach “scatter”. In this attempt to simplify and explain breaches we are now moving from wordy descriptions towards tighter and more structured language. Let’s review that language:
- One or more interactions.
- Between two or more entities.
- Each interaction has a method.
- As do subsequent interactions (if any).
- There is a change of state concerning data or systems or both.
- The changed state may go on to impact other entities.
My theory is that we can translate this language into simple diagrams that can be usefully understood by experts and novices alike.
“It doesn’t matter how beautiful your theory is, it doesn’t matter how smart you are, or what your name is. If it doesn’t agree with experiment, it’s wrong.” - Richard P. Feynman.
Time for an experiment. The test of a good diagram is that it works without any words. Most of the information is intrinsic. These breach diagrams are read left to right as the arrows suggest. Time only runs forwards. By convention, I’ve placed the attacker above the victim in simple 2-entity diagrams. I think of them as having a 2-dimensional Rube Goldberg quality.
Experiment 1.
| Respondent | Sales Exec (not InfoSec). No technical interest or knowledge |
|---|---|
| Question | Can you describe this breach? |
| Answer | “It’s a phishing attack” |
| “Some data was copied” | |
| “Then they went on to hack 2 other companies using keys” | |
| Verdict | Thank goodness, I may be on to something. |
Experiment 2.
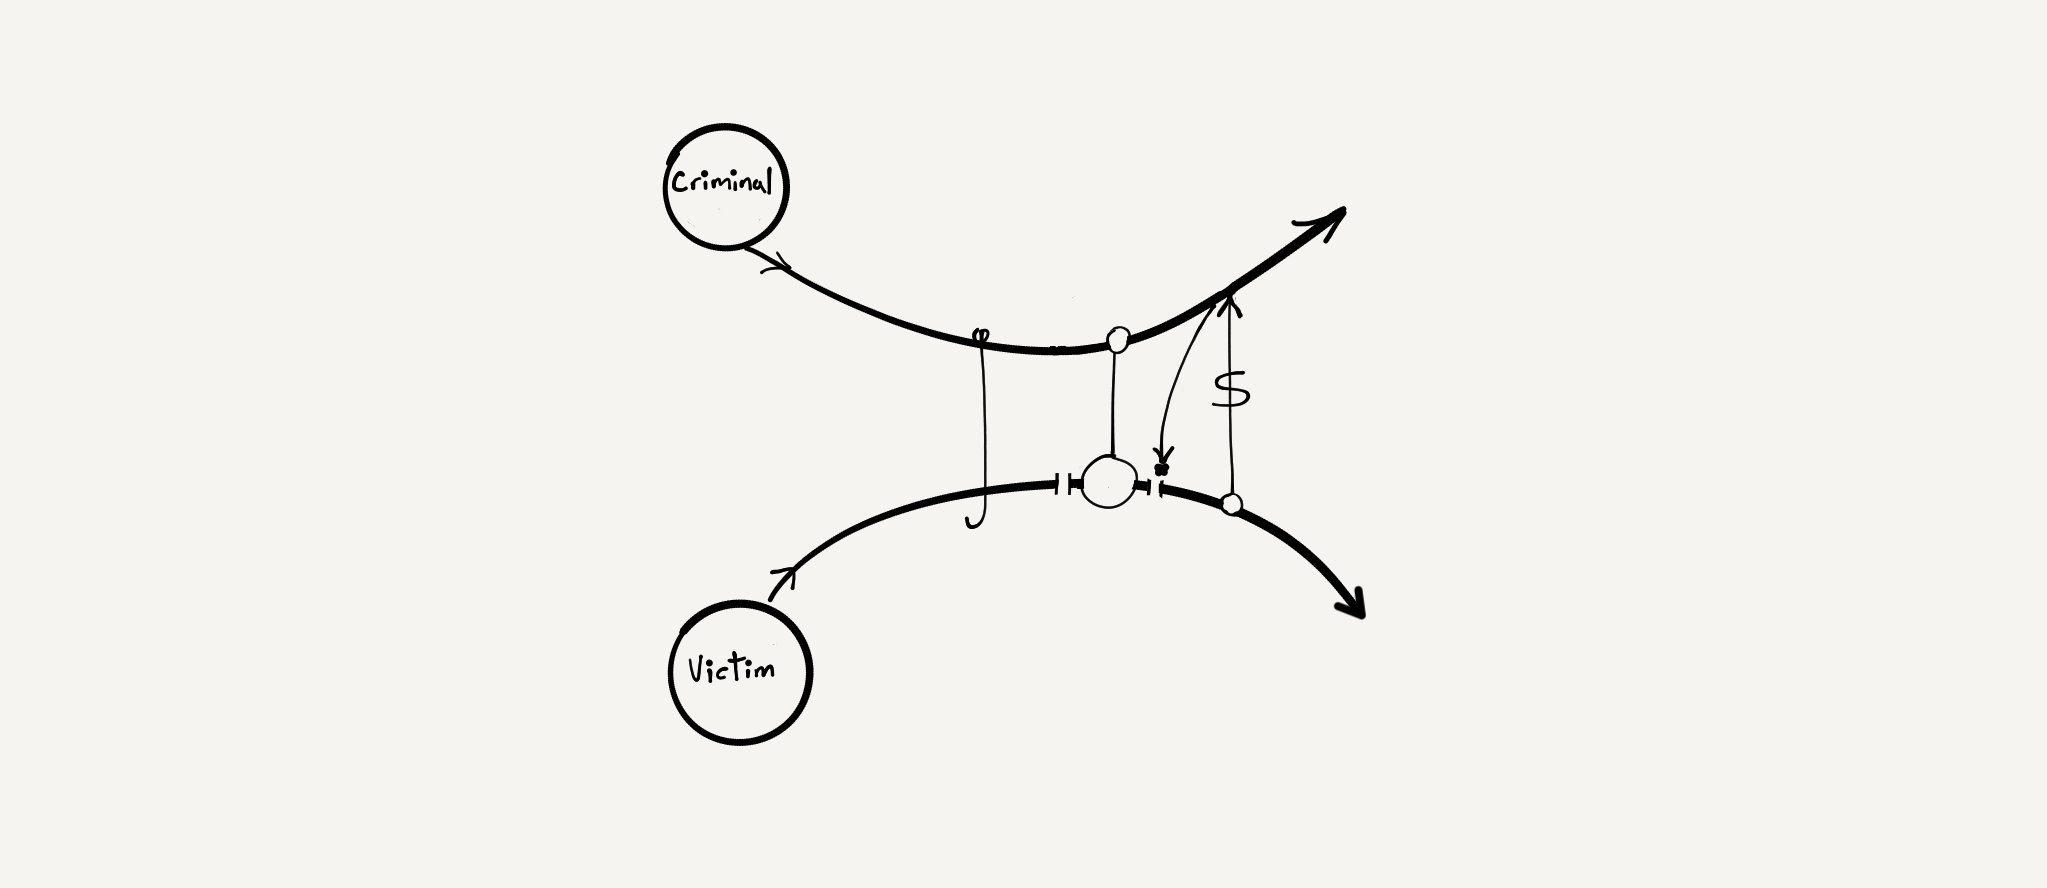
| Respondent | Sales Exec (not InfoSec). No technical interest or knowledge |
|---|---|
| Question | Can you describe this breach? |
| Answer | “It’s a phishing attack” |
| “Something was cut off from the victim” | |
| “The attacker could access it though” | |
| “The victim sent money to the attacker” | |
| “Then the victim could access his data again” | |
| Verdict | Success! |
Experiment 3.
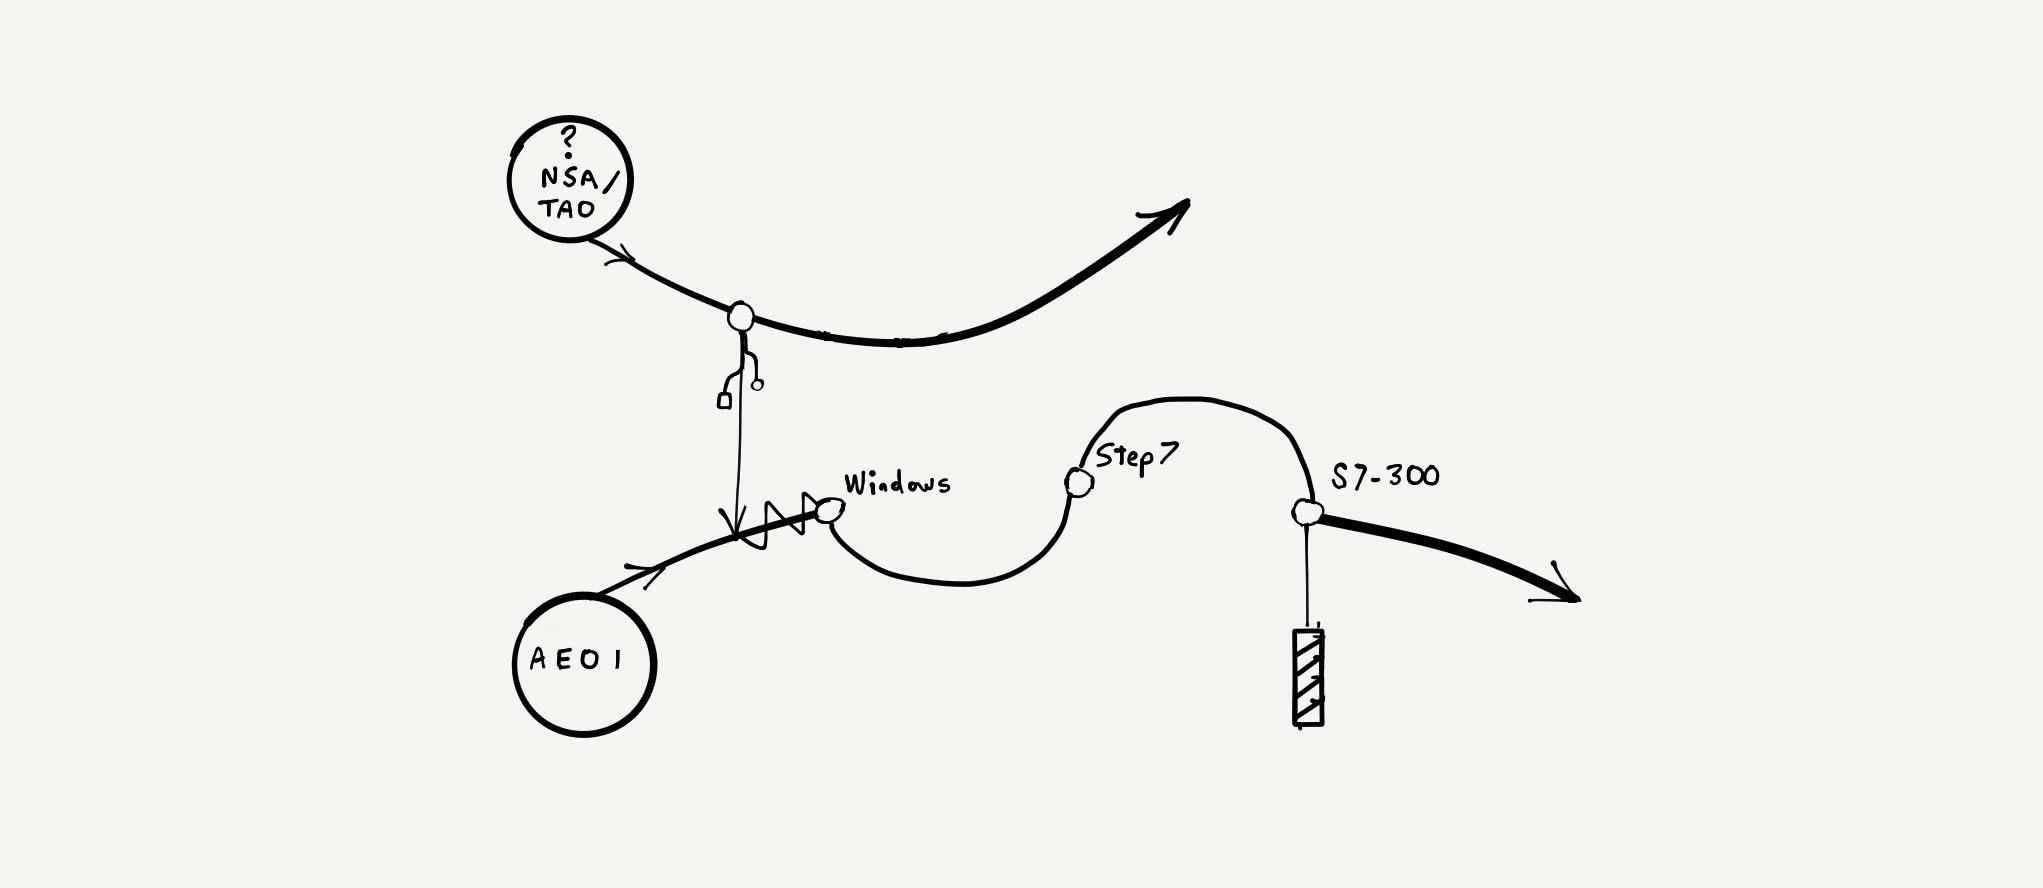
| Respondent | Sales Exec (not InfoSec). No technical interest or knowledge |
|---|---|
| Question | Can you describe this breach? |
| Answer | “It was a USB attack” |
| “Eventually a Windows machine was infected” | |
| “Then it got to step 7, whatever that is” | |
| “Then it went to S7-300, whatever that is” | |
| “Something attached to S7-300 was broken” | |
| Verdict | Acceptable. It was an ambitious goal. |
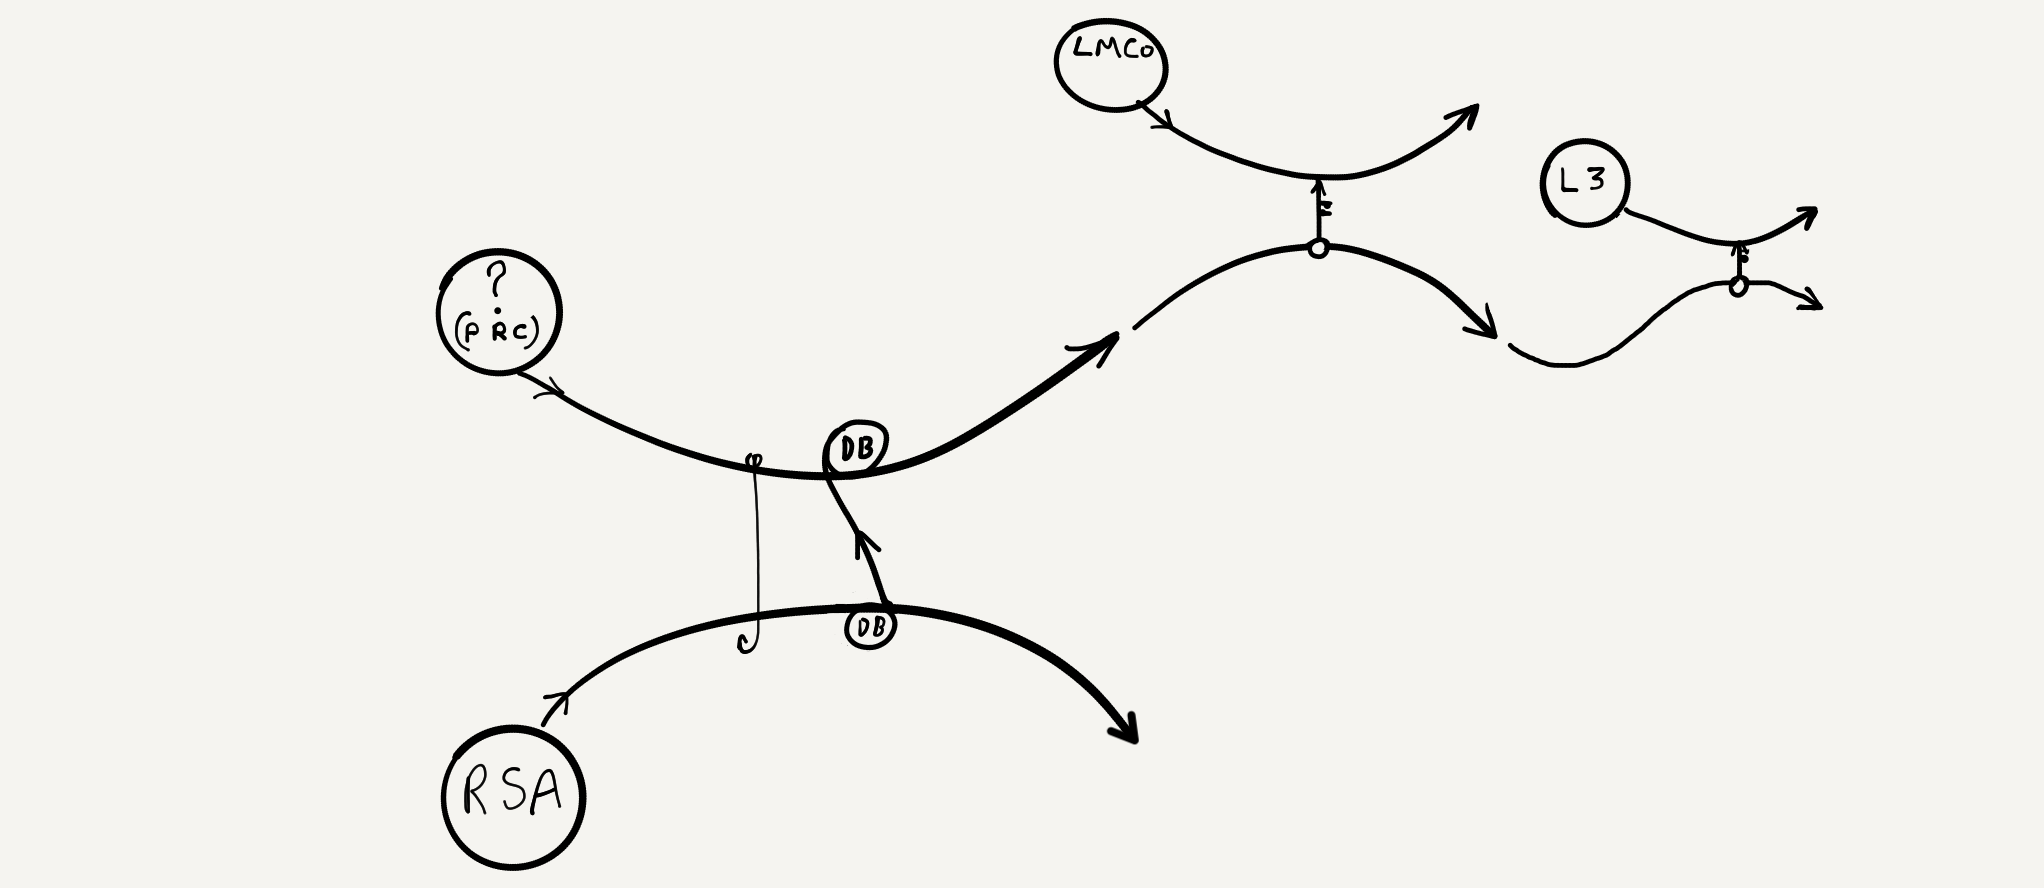
For each of the unlabelled diagrams above, click to reveal the annotated version. They are in order:
- 2011 RSA token database breach, attacks on Lockheed Martin and L3.
- 2017 NHS WannaCry ransomware (or any similar incident).
- 2010 Stuxnet attack on Iranian nuclear facilities.
Tools > Pictures > Words
The value of Feynman’s diagrams was that they simplified complex equations. Not only did his doodles convey helpful information, but they were also derived from real theories about the way particles interact. They were rooted in measurable, observable phenomena. How can we make our breach diagrams more than just doodles, more than just simplified infographics or timelines? How can they become a tool as well as a visual representation?
When a diagram becomes a tool it breaks free of the page. It becomes a weapon in the hands of the reader. Suddenly they realise a picture can make things happen in the real world. That realisation is the same jolt the audience feels when a stage actor breaks the fourth wall. It’s the most powerful effect any diagram can have.
- Can we make breach diagrams more real?
- Can we associate them directly with data?
- Can we generate such diagrams programmatically?
Most security documentation is done by hand. Most of it could and should be generated programmatically. I’ve alluded to a system for programmatically documenting compliance and attestation before.
In the last 20 years, automation of security has improved. From 1990s-era reflexive access lists, automatic IP address banning, dynamic email filtering, to some of the more sophisticated products and services around today. For the most part, we’re still trying to counter an industrialised adversary by using cottage industry methods. This mismatch extends right through to how we generate documentation.
The groundwork for programmatically generated breach diagrams has already been done. Initiatives like MITRE ATT&CK™ and CVE could be incorporated within an ontology. That ontology could be used to derive breach diagrams from real data. I’m going to experiment with this idea. I’m hopeful that out of those experiments will emerge that ontology and with it a set of symbols.
The hard part will be maintaining simplicity and correctness while resisting embellishment. On my side is my interest in semiotics and my lack of ability at drawing.
All that remains is to choose a name for these doodles. I can’t call them Feynman diagrams. Hutton diagrams? For now, I’m shortening that to H diagrams. Re-reading the quote at the top of this post, I think Euler would have approved. As for Feynman, I’d like to think he’d appreciate their simplicity. I’ve deliberately left the specification of H diagrams vague. Experiment with them yourself. Send me your contributions. Just make sure you adhere to the license.
This post is published under a Creative Commons Attribution-ShareAlike 4.0 International license by the original author, Nick Hutton.
-
My friend Richard Feynman, TEDx Caltech, Jan 2011 - Leonard Susskind, Professor of Theoretical Physics, Stanford University. 15 minutes on the personality, character, and humour of Richard Feynman. Guaranteed baloney free. ↩︎
-
Feynman Diagrams, Fermilab, Feb 2016 - Don Lincoln, Researcher, Fermi National Accelerator Laboratory. 6-minute explanation on the construction and significance of Feynman diagrams. ↩︎